Free · Private · No sign-up
See any elevation file on a map in seconds.
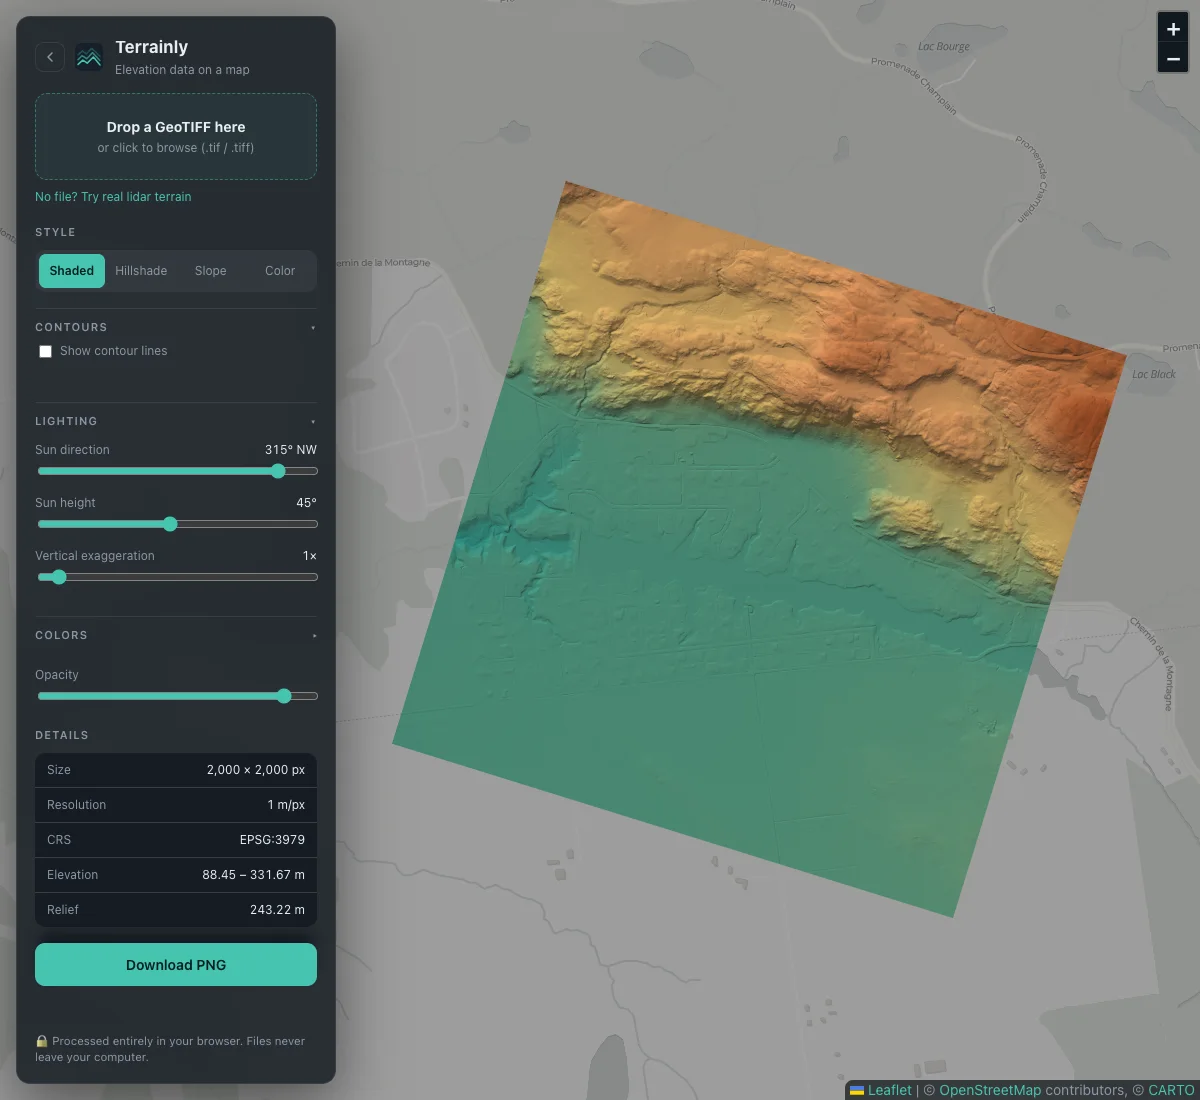
Drop a GeoTIFF DEM and get shaded relief, color-by-elevation and live height readouts on a real map. It all runs in your browser, so your data never leaves your computer.
- Stays on your device
- Huge files OK
- 6,000+ projections
One file, many looks
Bring out what’s hiding in the data
The same file, four different views, plus a slope map and contour lines in the viewer. Shading reveals roads, ditches and field edges that plain colors hide.
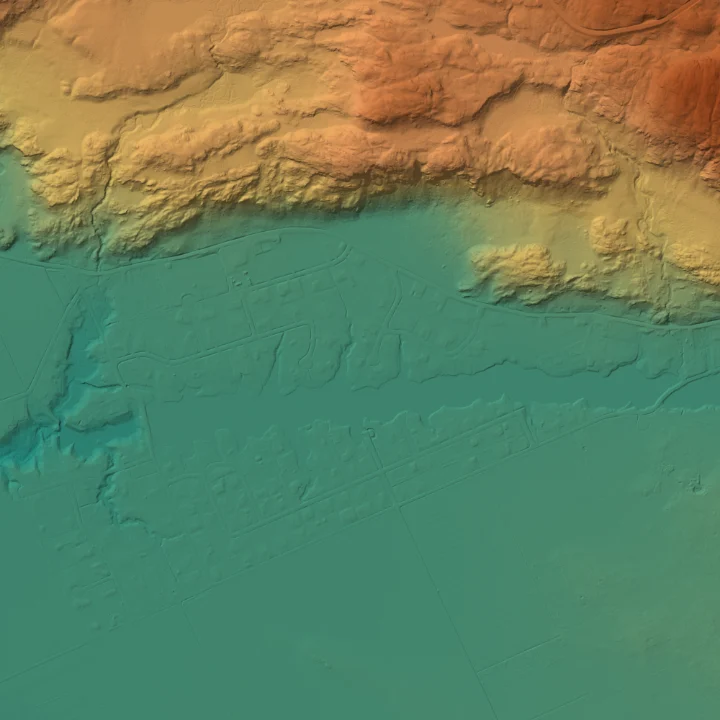
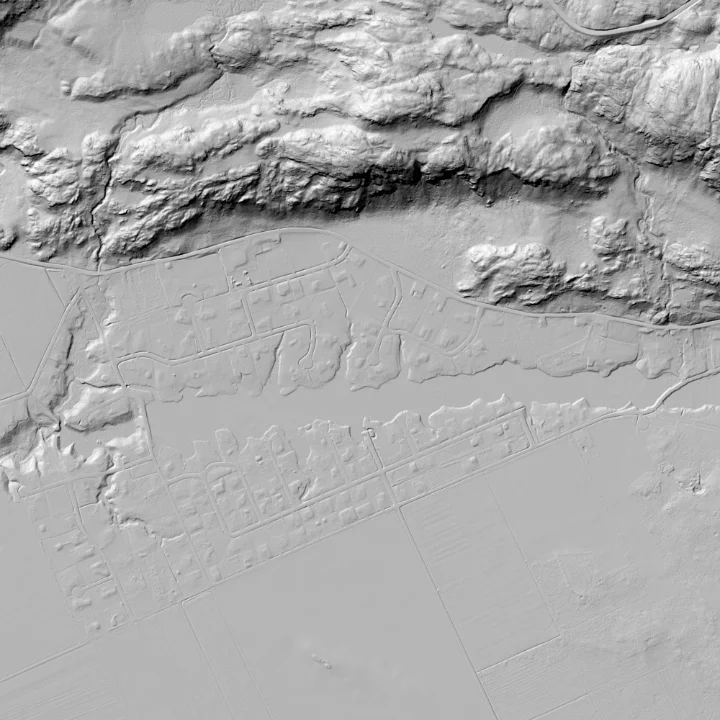
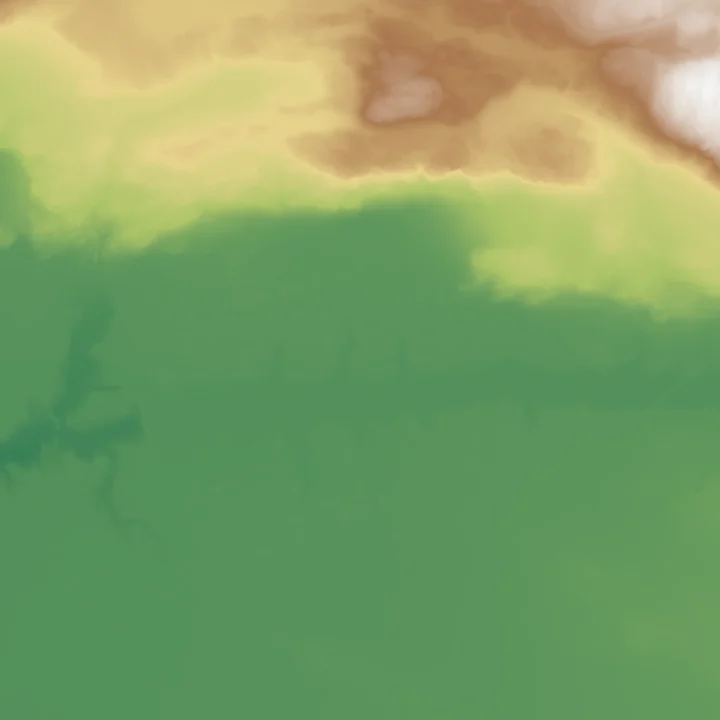
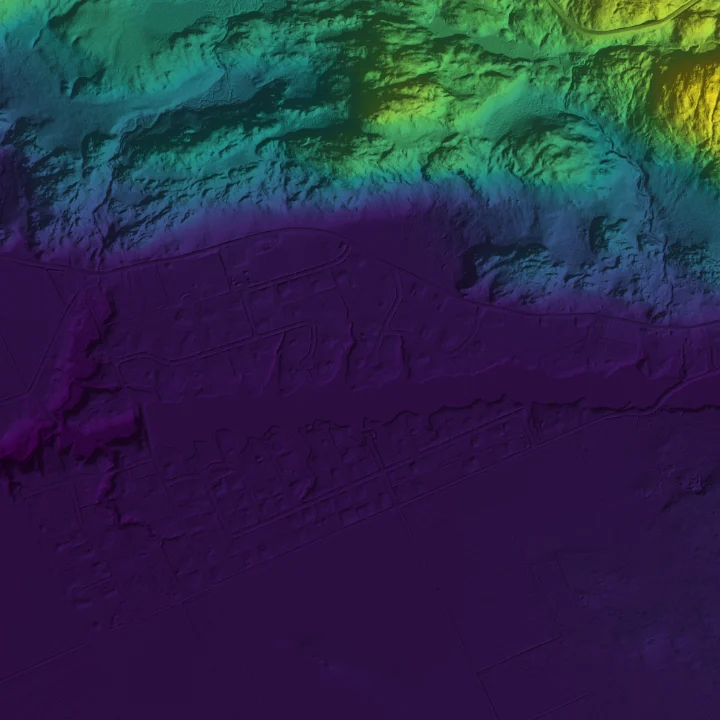
All four images: 1 m lidar of the Eardley Escarpment, Gatineau Park (HRDEM, Natural Resources Canada — Open Government Licence – Canada).
How it works
From file to terrain in three steps
No software to install, no account, no waiting for an upload.
Drop your file
Drag a
.tifelevation model onto the page, or click to browse. Big files are read in pieces with a progress bar.See it in place
The terrain appears at its real-world location on the map, whatever coordinate system the file uses.
Explore and export
Move the sun, switch to a slope map, add contour lines, hover for exact heights, then save a PNG of what you see.
Features
Built for the files people actually have
Real DEMs are messy. This viewer deals with the quirks so you can just look at the terrain.
Private by design
Your file is read in your browser tab and never uploaded anywhere.
6,000+ coordinate systems
UTM, Canadian MTM and Lambert, US State Plane, national grids. Placed correctly on the map.
Opens huge rasters
Tested on 108 million cells. Oversized files become a smooth preview instead of freezing the tab.
Light, slope and contours
Move the sun, switch to a slope map, or add labelled contour lines at any interval.
Your colors
Five color ramps, a custom elevation range, and a one-click “Trim 2–98%” for outliers.
Point and read
Hover anywhere on the terrain to read its elevation and coordinates.
Handles real-world quirks
NoData holes, feet instead of metres, half-pixel offsets, and ZSTD, LZW, DEFLATE or LERC compression.
Export a PNG
Save the rendered terrain as an image for reports, slides or a quick message to a colleague.
Privacy
Your file never leaves your computer.
Survey data and unpublished elevation models are often sensitive. This viewer has no upload step at all: everything is decoded and drawn by your own browser.
- No account, no tracking of your files. There is nothing to sign in to.
- Easy to verify. Open your browser’s developer tools, switch to the Network tab and load a file. You will only see the app itself and map tiles.
- One honest detail: the background map comes from CARTO (built on OpenStreetMap data), so CARTO can see which area you are viewing, but never your data. Read the full privacy page.
Who it’s for
Anyone who needs a quick look at terrain
When opening a full GIS would be overkill.
Drone and survey crews
Check that an exported DEM looks right, in the right place, before it goes to a client.
GIS analysts
Peek at a download in seconds and decide if it’s the dataset you wanted.
Students and teachers
Explore real lidar and satellite terrain and see how hillshading actually works.
Curious explorers
Hikers, geologists and map fans: look at the shape of the land anywhere there’s data.
What’s next
More terrain tools are on the way
Planned, in no particular order. No promises on timing.
- PlannedAspect map
- PlannedElevation profiles
- PlannedDistance and area measuring
- PlannedCut and fill volumes
Learn
Guides for working with elevation data
Plain-language help, whether you’re new to DEMs or just need to find some data.
How to open a GeoTIFF / DEM online
A step-by-step walkthrough with no software to install.
Read the guide →What is a DEM?
DEM vs DSM vs DTM, resolution, datums and what the numbers mean.
Read the guide →Where to download free DEMs
Canada, the US and the whole world, with links that work.
Read the guide →My GeoTIFF won’t load
Every message you might see, what it means, and how to fix it.
Read the guide →FAQ
Questions, answered
What is a DEM?
A Digital Elevation Model (DEM) is a raster grid in which every cell stores the height of the ground at that spot. It is usually saved as a GeoTIFF, which also records where on Earth the grid belongs. Learn more.
Is it free? Do I need an account?
Yes, it is free to use and there is no account or sign-up.
Is my file uploaded anywhere?
No. Your file is read and drawn inside your browser and is never sent to a server. The background map is loaded from CARTO (built on OpenStreetMap data), so CARTO can see which area of the map you are looking at, but it never receives your data.
Which file types work?
Single-band GeoTIFF elevation rasters (.tif or .tiff), uncompressed or compressed with LZW, DEFLATE, ZSTD, PackBits, LERC or JPEG. Other formats such as ASC, HGT or IMG need to be converted to GeoTIFF first — see the troubleshooting guide.
How big can the file be?
There is no fixed limit. A 108-million-cell raster (432 MB uncompressed) opened in under 10 seconds in our tests. Rasters above 16 million cells are shown as a reduced-resolution preview made by averaging cells, and very large files depend on your device’s memory.
Which coordinate systems are supported?
More than 6,000, including UTM, Canadian MTM and Lambert, US State Plane and many national grids. If a file uses an unsupported system the viewer tells you, and you can reproject it with QGIS or gdalwarp.
Can I use it for surveying or volume calculations?
No. It is a visualization tool. Elevation readings come straight from your file and are not verified, so do not use it as a substitute for professional survey or engineering work. See the terms and disclaimer.
Why does my DEM look flat or all one color?
Usually a few extreme values or NoData cells stretch the color scale. Use the Trim 2–98% button or type a custom elevation range. More tips in the troubleshooting guide.
Ready to see your terrain?
Drop a file, or explore real lidar from Gatineau Park. It takes a few seconds.
Open the viewer →